Single Variable Modeling
Looking ahead
Objectives
- Given observed data, determine the most appropriate function type to model it.
- Given data and a proposed model type, approximate the parameters by hand.
- In R, use
fitModel()to obtain the best-fit model of the most appropriate type. - Describe how collecting additional data can change how the model fits or which model type is most appropriate.
- Describe the two primary reasons for modeling data: inference and prediction.
- Define extrapolation, and which input values a model can be expected to give reasonable outputs for.
Testing Tips
- Skim the whole quiz first. A first pass shows which questions will take longest.
- Keep moving. Leave a question that stalls and come back to it at the end.
- Read the instructions before the quiz: Math 141 Quiz 1 Instructions (Teams).
- Scope: every objective through Lesson 10 is on the quiz.
1. Choosing the Model Family
Objective. Given observed data, determine the most appropriate function type to model it.
Model families.
Family Model form Identifying feature Plot in R Linear standard plot linear plotPoints(y ~ x)Exponential semi-log plot linear plotPoints(log(y) ~ x)Power log-log plot linear plotPoints(log(y) ~ log(x))Sine oscillates and repeats plotPoints(y ~ x)Sigmoid levels off at both ends plotPoints(y ~ x)
Choosing from the plots.
- Graph the standard plot. If it is linear, then a linear model is reasonable.
- If the standard plot oscillates and repeats, then a sine model is reasonable.
- If the standard plot levels off at both ends, then a sigmoid model is reasonable. A sigmoid model is also reasonable when the plot levels off at one end and the situation supplies the level at the other, as for
TwitterUsers3on the Lesson 9 sheet. - If the standard plot rises or falls along a curve, graph the semi-log plot and the log-log plot. If the semi-log plot is linear, an exponential model is reasonable. If the log-log plot is linear, a power model is reasonable.
- If more than one plot is close to linear, then the most appropriate family is the one whose plot keeps one slope from end to end, with no bend. When neither plot bends, both families are reasonable, as in Example 2.
Axis labels. Check the axis labels before judging the shape, because the standard, semi-log, and log-log plots look alike in R apart from their labels. A straight plot with on the vertical axis and on the horizontal axis is a linear semi-log plot.
Example 1
The NASDAQQuarterly dataset records the closing NASDAQ value Close in dollars at the end of each quarter. A Quarter of 1 is March 1938, and a Quarter of 308 is December 2014. Determine the most appropriate function type to model Close as a function of Quarter.
ShowHide solution
Graph the standard, semi-log, and log-log plots:
plotPoints(Close ~ Quarter, data = NASDAQQuarterly)
plotPoints(log(Close) ~ Quarter, data = NASDAQQuarterly)
plotPoints(log(Close) ~ log(Quarter), data = NASDAQQuarterly)
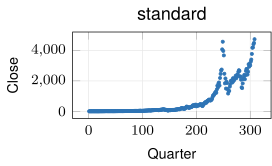
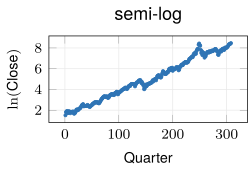
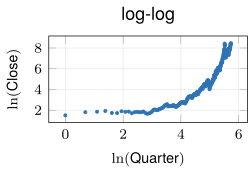
R labels the vertical axis of the last two plots log(Close), its spelling of . The standard plot curves upward: the closing value stays below 500 until Quarter 215 and reaches 4736.05 at Quarter 308. The semi-log plot follows one straight trend from Quarter 1 to Quarter 308, apart from a bump around Quarter 249, where the closing value peaks at 4572.83 and then falls to 1335.51 by Quarter 260. The log-log plot bends upward across the whole record. An exponential model is the most appropriate, because the semi-log plot is the one with a straight trend.
Example 2
The NaturalGasConsumption dataset records United States natural gas consumption CubicFeet in millions of cubic feet for each Year from 1950 to 1970. Determine every function type that is a reasonable model of CubicFeet as a function of Year.
ShowHide solution
Graph the standard, semi-log, and log-log plots:
plotPoints(CubicFeet ~ Year, data = NaturalGasConsumption)
plotPoints(log(CubicFeet) ~ Year, data = NaturalGasConsumption)
plotPoints(log(CubicFeet) ~ log(Year), data = NaturalGasConsumption)
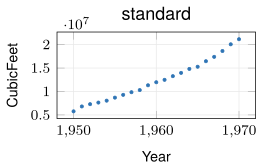
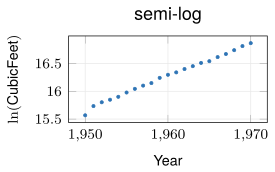
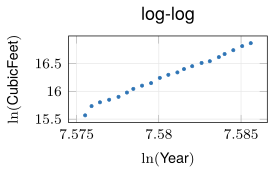
The standard plot curves upward. The semi-log and log-log plots both run straight from 1950 to 1970 with no bend, and they look alike, because runs only from 7.5756 to 7.5858. Over an input interval that narrow and that far from 0, is nearly linear in . An exponential model and a power model are both reasonable, because neither logged plot bends.
Next: 2. Approximating the Parameters by HandLesson map
2. Approximating the Parameters by Hand
Objective. Given data and a proposed model type, approximate the parameters by hand.
By-hand estimates.
Linear model. For (Lesson 4 sheet, section 2), take and from the first data point and the last :
Exponential model. For (Lesson 5 sheet, section 2, and Lesson 6 sheet, sections 2 and 3), set , the first input. The constant is the output at , which makes . When , the constant is the vertical intercept. The rate is the slope of the semi-log line through the first and last data points:
Power model. For (Lesson 7 sheet, section 3), take and from the log-log line through the first and last data points:
Sine model. For (Lesson 8 sheet, section 3), take and from a top level and a bottom level :
The period is the input distance from one peak to the next. The horizontal shift is the first input where the data cross while increasing.
Sigmoid model. For (Lesson 9 sheet, section 4), take and from the levels on the left and on the right:
The mean is the input where the data pass the halfway output . Let be the input where the data pass the five-sixths level . The spread is .
Example 3
The TwitterUsers1 dataset records Twitter users Users in millions for eight quarters. The variable Year counts years since 2000. The first data point is , and the last is . Approximate the parameters of a linear model by hand.
ShowHide solution
The line through the first and last data points has
Substituting and gives
The by-hand model is .
Example 4
The NaturalGasConsumption dataset records 5,766,542 million cubic feet in 1950, its first year, and 21,139,386 in 1970, its last. Approximate by hand the parameters of the exponential model
ShowHide solution
Take , the first input. Then , the output at . The slope of the semi-log line through the first and last data points is :
The by-hand model is
Example 5
The FiddlerCrabs dataset records the body size BodySize and the palm length PalmLength of growing male fiddler crabs, both in millimeters. The smallest crab has and . The largest has and . Approximate by hand the parameters of the power model
ShowHide solution
The log-log line through the data points of the smallest and largest crabs has slope and intercept :
R computes both values:
k = (log(11.66) - log(1.07))/(log(16.18) - log(3.43))
lnC = log(1.07) - k*log(3.43)
k
exp(lnC)
The last two lines print [1] 1.539764 and [1] 0.1603826. The by-hand model is
Example 6
The HenWeight dataset records the mean Weight of hens in grams at ages Day 0 to 170. Approximate the parameters of a sigmoid model by hand.
ShowHide solution
The data start from the hatching weight, about , and levels off near :
The halfway output falls between Day 71, at 832.57, and Day 85, at 1009.48. Join those two data points with a straight line. On it, lies the same fraction of the way from Day 71 to Day 85 as 878.5 lies from 832.57 to 1009.48:
The five-sixths level lies just below the Day 113 weight, 1440.18. The five-sixths crossing is , and the spread is
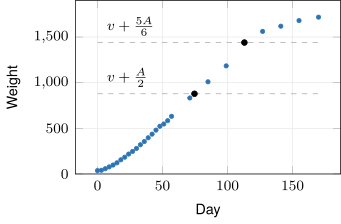
In the figure, the dashed lines are the halfway output 878.5 and the five-sixths level 1439.5. The black points are and , where the data pass those two levels. The by-hand model is
Next: 3. Obtaining the Best Fit in RLesson map
3. Obtaining the Best Fit in R
Objective. In R, use fitModel() to obtain the best-fit model of the most appropriate type.
Linear, exponential, and power models are fitted as a line on the plot that straightens them: the standard, semi-log, or log-log plot. Sine and sigmoid models are fitted on the standard plot. Their fits need starting values, start=, taken from the by-hand estimates of section 2.
In each call below, y stands for the output’s name, x for the input’s name, and D for the dataset’s name. Spell each name as in the dataset.
fitModel() by family.
Linear model
fitModel(y ~ m*x + b, data = D)
Exponential model
fitModel(log(y) ~ m*(x - h) + b, data = D)
Type the number for , as in m*(Year - 1950). Then and .
Power model
fitModel(log(y) ~ m*log(x) + b, data = D)
Then and .
Sine model
fitModel(y ~ A*sin(2*pi/P*(x - h)) + v, data = D,
start = list(A = ..., P = ..., h = ..., v = ...))
Sigmoid model
fitModel(y ~ A*pnorm(x, m, s) + v, data = D,
start = list(A = ..., m = ..., s = ..., v = ...))
Typed-in data. For data typed in as vectors with c(), leave data = off the call (Lesson 4 sheet, section 3).
Outputs of a log fit. A model fitted to log(y) returns outputs in the data’s own units. Applying exp() to those outputs is a mistake.
Singular gradient error. The function fitModel() stops with this error when a sine or sigmoid fit has no start=. It also stops with this error when the formula has a letter where a number belongs, such as h in an exponential fit.
> fitModel(log(CubicFeet) ~ m*(Year - h) + b, data = NaturalGasConsumption)
Error in nlsModel(formula, mf, start, wts, scaleOffset = scOff, nDcentral = nDcntr) :
  singular gradient matrix at initial parameter estimates
Drawing the fit. The function fitModel() prints no warning when a fit is poor. Draw every fit on its data:
- Plot the data with
plotPoints(). - Add the fitted model with
plotFun(..., add = TRUE). - Check that the curve passes through the data across the whole input interval, with no stretch where the points sit all above or all below it.
Example 7
For the NaturalGasConsumption dataset of Example 2, use fitModel() to obtain the best-fit exponential model with , and graph it with the data.
ShowHide solution
Fit the semi-log line with and print its slope and intercept:
gasExp = fitModel(log(CubicFeet) ~ m*(Year - 1950) + b,
data = NaturalGasConsumption)
coef(gasExp)
The last line prints
m b
0.06052149 15.66248660
Then
The best-fit model is
Graph the fitted model function with the data:
plotPoints(CubicFeet ~ Year, data = NaturalGasConsumption)
plotFun(gasExp(Year) ~ Year, add = TRUE, col = "red")
The curve stays within 10 percent of every recorded value from 1950 to 1970.
Example 8
The table gives the cumulative worldwide sales of the Nintendo Switch in millions of units, from the NintendoSwitch dataset.
| Year | 2017 | 2018 | 2019 | 2020 | 2021 | 2022 | 2023 | 2024 |
| Sales | 13.12 | 29.46 | 48.82 | 76.83 | 100.96 | 120.01 | 136.41 | 142.37 |
Type the table into R, and use fitModel() to obtain the best-fit sigmoid model.
ShowHide solution
Estimate the four parameters by hand, then use them as starting values for fitModel(). Cumulative sales start from before the 2017 launch and level off near , which gives
The halfway output falls between 2019, at 48.82, and 2020, at 76.83. Interpolate between those two data points as in Example 6:
The five-sixths level falls between 2022, at 120.01, and 2023, at 136.41. Interpolating the same way gives
The spread is
Type in the table and fit from these starting values:
Year = c(2017:2024)
Sales = c(13.12, 29.46, 48.82, 76.83, 100.96, 120.01, 136.41, 142.37)
ns = fitModel(Sales ~ A*pnorm(Year, m, s) + v,
start = list(A = 145, m = 2019.8, s = 2.3, v = 0))
coef(ns)
plotPoints(Sales ~ Year)
plotFun(ns(Year) ~ Year, add = TRUE, col = "red")
The coef() line prints
A m s v
150.833139 2019.897051 2.302102 -2.339220
The best-fit model is
Next: 4. Additional Data and the Model ChoiceLesson map
4. Additional Data and the Model Choice
Objective. Describe how collecting additional data can change how the model fits or which model type is most appropriate.
Additional data can change the most appropriate family. Over a short enough input interval, every smooth curve looks close to linear, and a short record may show only that nearly straight stretch. The bends of the curve appear as the record grows, as in Example 9.
Additional data can also keep the family and change the fitted parameters. A short record leaves a parameter poorly determined, and more data can move it a long way, as in Example 10.
Example 9
The TwitterUsers datasets record Twitter users Users in millions by quarter. The variable Year counts years since 2000.
- The dataset
TwitterUsers1has eight quarters, Year 12 to 13.75. - The dataset
TwitterUsers2has those eight and the seven before them, from Year 10.25. - The dataset
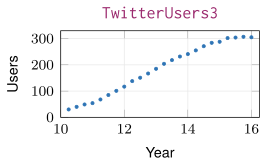
TwitterUsers3has all fifteen and nine more, through Year 16.
Determine the most appropriate function type for each dataset. Then describe how the additional data changed the choice.
ShowHide solution
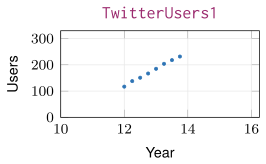
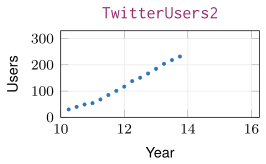
Linear model for TwitterUsers1. The eight readings are 117, 138, 151, 167, 185, 204, 218, and 231.7 million users, and they climb steadily. The slopes between successive points are 84, 52, 64, 72, 76, 56, and 54.8 million users per year, with no trend. Fit a line:
t1 = fitModel(Users ~ m*Year + b, data = TwitterUsers1)
coef(t1)
The last line prints
m b
65.70952 -669.54762
The best-fit line is .
Power model for TwitterUsers2. The seven added quarters rise slowly, and the eight quarters of TwitterUsers1 rise faster. One line cannot follow both stretches. The semi-log plot bends downward, and the log-log plot is closer to linear:
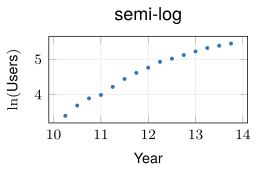
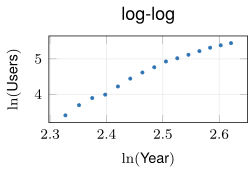
Graph both plots and fit the log-log line:
plotPoints(log(Users) ~ Year, data = TwitterUsers2)
plotPoints(log(Users) ~ log(Year), data = TwitterUsers2)
t2 = fitModel(log(Users) ~ m*log(Year) + b, data = TwitterUsers2)
coef(t2)
The last line prints
m b
6.979725 -12.686064
The best-fit power model is .
Sigmoid model for TwitterUsers3. The nine added quarters level off near 305 million users. The power model no longer fits, because a power model with and a positive exponent rises without a ceiling, while a sigmoid model levels off. For starting values, users start from and level off near 305, which gives . The halfway output falls near Year 12.5, which gives . The five-sixths level falls near Year 14.25, and the spread is
Fit from these starting values:
t3 = fitModel(Users ~ A*pnorm(Year, m, s) + v, data = TwitterUsers3,
start = list(A = 305, m = 12.5, s = 1.75, v = 0))
coef(t3)
The last line prints
A m s v
325.967050 12.624146 1.870370 -3.973633
The best-fit sigmoid model is
The most appropriate family changed twice, from linear to power to sigmoid, while the eight points of TwitterUsers1 stayed the same. They are the steep middle of the sigmoid, and only the quarters added on each side show its bends.
Example 10
The TemperaturesDanville dataset records the average maximum temperature in degrees Fahrenheit in Danville, Kentucky, at the start of each month, with Month 0 to 59 counting months from January 2006. Fit a sine model to the first 12 months alone (Month 0 to 11), then to all 60 months, from the same starting values. Compare the two periods, and compare each model’s output at Month 30 with the recorded 86 degrees.
ShowHide solution
Approximate the starting values by hand from the plot of all 60 months, drawn on the Lesson 8 sheet, section 2. A level of 88 through the typical peaks and one of 32 through the typical troughs give
Temperature repeats each year, which gives months. The data cross 60 while increasing between Month 2 (53.8) and Month 3 (69.3), and the midpoint of the two months gives . Fit both models from these values, print their parameters, and evaluate each at 30:
year1 = TemperaturesDanville[TemperaturesDanville$Month <= 11, ]
fit1 = fitModel(Temperature ~ A*sin(2*pi/P*(Month - h)) + v, data = year1,
start = list(A = 28, P = 12, h = 2.5, v = 60))
fitAll = fitModel(Temperature ~ A*sin(2*pi/P*(Month - h)) + v,
data = TemperaturesDanville,
start = list(A = 28, P = 12, h = 2.5, v = 60))
coef(fit1)
coef(fitAll)
fit1(30)
fitAll(30)
The two coef() lines print
A P h v
18.835429 10.875087 3.330367 67.288006
A P h v
23.286833 11.982097 3.163625 65.358279
and the last two lines print [1] 72.84217 and [1] 88.59642. The one-year fit has period months, short of the 12-month year. At Month 30 it gives about 72.842 degrees, which falls degrees below the recorded value. The five-year fit has months. At Month 30 it gives about 88.596 degrees, which lies degrees above the recorded value. The family stayed the same. The four added years of data moved the period close to 12 months and the prediction close to the record.
Next: 5. Inference and PredictionLesson map
5. Inference and Prediction
Objective. Describe the two primary reasons for modeling data: inference and prediction.
Definition 1 (Inference).
Inference is the use of a model’s fitted parameters to describe how the output variable depends on the input variable.
An inference question asks how the variables relate: whether the output grows or decays, at what rate, and on what cycle.
The model’s output at one chosen input, such as the gas consumption it gives for 1965.5, is not an inference, because it describes no relationship between the variables. The definition of inference uses the fitted parameters to describe how the output depends on the input.
Definition 2 (Prediction).
Prediction is the use of a model to estimate the output value at a chosen input, typically one the data does not record.
A prediction question asks for the output at a chosen input.
The 5,766,542 million cubic feet recorded for 1950 in NaturalGasConsumption is not a prediction, because it comes from the data’s own row. The definition of prediction requires a model to estimate the output.
Example 11
The best-fit exponential model for NaturalGasConsumption, 1950 to 1970, is
Classify each question as inference or prediction, and answer it.
- (a) Was natural gas consumption growing from 1950 to 1970, and at what rate?
- (b) What consumption does the model give at Year 1965.5, halfway between the recorded years 1965 and 1966?
ShowHide solution
(a) The question is an inference, because by the definition of inference its answer comes from the fitted parameter , which describes how consumption depends on the year. Consumption was growing, because is positive. The growth rate was about 6 percent per year.
(b) The question is a prediction, because by the definition of prediction its answer is the model’s estimate of the output at a chosen input, here one the data do not record. Fit the model and evaluate it at 1965.5:
gasExp = fitModel(log(CubicFeet) ~ m*(Year - 1950) + b,
data = NaturalGasConsumption)
gasExp(1965.5)
The last line prints [1] 16200777: the model gives 16,200,777 million cubic feet at Year 1965.5.
Example 12
The best-fit sine model for all 60 months of TemperaturesDanville is
Classify each question as inference or prediction.
- (a) How long is one cycle of Danville’s temperatures?
- (b) What average maximum temperature does the model give for February 2024?
- (c) By how many degrees do the summer peaks exceed the winter troughs?
ShowHide solution
(a) Inference, because the fitted period months answers it.
(b) Prediction, because it asks for the model’s output at one input. With Month 0 in January 2006, February 2024 is Month , an extrapolation 158 months past the data.
(c) Inference, because the fitted amplitude answers it: the swing is degrees.
Next: 6. Extrapolation and Reliable Input ValuesLesson map
6. Extrapolation and Reliable Input Values
Objective. Define extrapolation, and which input values a model can be expected to give reasonable outputs for.
An interpolation is a prediction at an input that lies inside the input interval used to create the model.
Definition 3 (Extrapolation).
An extrapolation is a prediction at an input that lies outside the input interval used to create the model.
An extrapolation can be far off, because the data give no evidence about outputs at inputs outside the input interval used to create the model.
The prediction at Year 1965.5 in Example 11 is not an extrapolation, because 1965.5 lies inside the input interval 1950 to 1970 used to create the model. The definition requires an input outside that interval.
Reliable input values. A model can be expected to give reasonable outputs for inputs inside the input interval used to create it. The statement applies to a model that is reasonable for the data, as judged in section 1, and drawn on the data as in section 3.
A sine model that is reasonable for data from a repeating process, such as the seasons, also gives reasonable outputs a cycle past the data, because the process repeats.
Beside every extrapolated answer, state the input interval used to create the model, as in Example 14.
Example 13
The NASDAQQuarterly dataset records the closing NASDAQ value Close for Quarter 1 to 308. Fit the exponential model with :
Evaluate the model at Quarter 220 and at Quarter 340, and state whether each evaluation is an interpolation or an extrapolation.
ShowHide solution
Fit the semi-log line with and evaluate the model at each quarter:
nq = fitModel(log(Close) ~ m*Quarter + b, data = NASDAQQuarterly)
nq(220)
nq(340)
The last two lines print [1] 638.7816 and [1] 9602.522. The value 638.782 at Quarter 220 is an interpolation, because 220 lies inside the input interval 1 to 308 used to create the model. The recorded value in the data’s row for Quarter 220 is 676.95, and the model’s value falls 38.168 below it, about 5.6 percent of the recorded value. By the definition of extrapolation, the value 9602.522 at Quarter 340 is an extrapolation, because 340 lies outside the input interval 1 to 308 used to create the model.
Example 14
The most appropriate models for the TwitterUsers datasets of Example 9 are linear for TwitterUsers1 (Year 12 to 13.75), power for TwitterUsers2 (Year 10.25 to 13.75), and sigmoid for TwitterUsers3 (Year 10.25 to 16). Fit the three models, evaluate each at Year 15.5, and state whether each evaluation is an interpolation or an extrapolation. Compare each value with the 304 million users recorded at Year 15.5.
ShowHide solution
The sigmoid needs starting values from the TwitterUsers3 data. Users start from and level off near 305, which gives . The data pass the halfway output near Year 12.5 and the five-sixths level near Year 14.25:
Fit the three models and evaluate each at Year 15.5:
t1 = fitModel(Users ~ m*Year + b, data = TwitterUsers1)
t2 = fitModel(log(Users) ~ m*log(Year) + b, data = TwitterUsers2)
t3 = fitModel(Users ~ A*pnorm(Year, m, s) + v, data = TwitterUsers3,
start = list(A = 305, m = 12.5, s = 1.75, v = 0))
t1(15.5)
t2(15.5)
t3(15.5)
The last three lines print [1] 348.95, [1] 629.0712, and [1] 301.759.
| Model | Input interval | At Year 15.5 | Evaluation |
Linear, t1 | 12 to 13.75 | 348.950 | extrapolation |
Power, t2 | 10.25 to 13.75 | 629.071 | extrapolation |
Sigmoid, t3 | 10.25 to 16 | 301.759 | interpolation |
The interpolation lands within 3 million users of the recorded 304. The two extrapolations miss by about 45 million and about 325 million.