Introduction to Functions
Looking ahead
Objectives
- Determine if a mapping between inputs and outputs is a function.
- Given a function, identify the output variable, the input variable(s), and the domain.
- Evaluate a function at a given input, by hand and using R.
- Given a function, determine whether its inverse exists, and if so, find it.
1. Functions
Objective. Determine if a mapping between inputs and outputs is a function.
In a mapping diagram, an arrow runs from each input to its output.
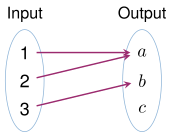
(a) A function
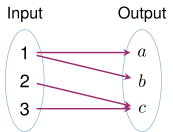
(b) Not a function
Diagram (a) is a function, because every input has exactly one arrow leaving it. Inputs 1 and 2 share the output , and a shared output is allowed. No arrow reaches the output , and an unused output is allowed too. Diagram (b) is not a function, because input 1 has two arrows leaving it.
Definition 1 (Function).
A function is a rule assigning every input to exactly one output.
In symbols, means the input is assigned to the output .
The pairs and , read as input and output, are not a function, because the input 1 is assigned to two outputs. The definition assigns every input to exactly one output.
Example 1
Determine whether each rule is a function.
- (a) Given a cadet, what squadron is the cadet in?
- (b) Given a number, what is twice that number?
- (c) Given a temperature, at what time today was it that hot?
- (d) Given a number, what is its square root?
ShowHide solution
By the definition of a function, a rule is a function when it assigns every input to exactly one output.
- (a) The rule is a function, because every cadet belongs to exactly one squadron.
- (b) The rule is a function, because every number has exactly one double.
- (c) The rule is not a function, because the same temperature can occur at two times in one day.
- (d) The rule is not a function, because the input 9 has two square roots, 3 and . The radical sign names only the non-negative one, , and the rule “given a number, what is ?” is a function on the non-negative numbers.
Tables. A table lists the inputs in the top row and the outputs in the bottom row. A table defines a function when no input appears with two different outputs. An input listed twice with the same output both times still has exactly one output.
Example 2
Determine whether each table defines a function.
(a) 1.15
| Input | 2 | 5 | 7 | 5 | 9 |
| Output | 3 | 8 | 3 | 8 | 1 |
(c) 1.15
| Input | 0 | 1 | 2 | ||
| Output | 4 | 1 | 0 | 1 | 4 |
(b) 1.15
| Input | 1 | 2 | 4 | 2 | 7 |
| Output | 5 | 6 | 5 | 9 | 2 |
(d)
| Input | 6 | 6 | 6 |
| Output | 2 | 5 | 8 |
ShowHide solution
- (a) Table (a) defines a function, because every input has one output. Input 5 appears twice, with output 8 both times. Output 3 comes from the two inputs 2 and 7.
- (b) Table (b) does not define a function, because input 2 gives two outputs, 6 and 9.
- (c) Table (c) defines a function, because each input appears once.
- (d) Table (d) does not define a function, because input 6 gives the three outputs 2, 5, and 8.
As in the textbook, a curve that is the graph of a function is itself called a function.
Criterion 2 (Vertical line test).
A curve in the -plane is a function if and only if every vertical line intersects the curve at most once.
A vertical line intersects the curve at one point for each output paired with the input . A vertical line that intersects the curve twice shows that the input has two outputs. The test also allows a vertical line that misses the curve, because “at most once” includes zero times.
Example 3
Use the vertical line test to determine whether each curve is a function.
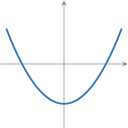
(a)
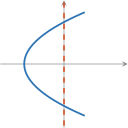
(b)
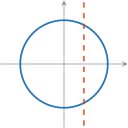
(c)
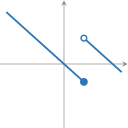
(d)
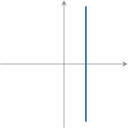
(e)
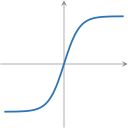
(f)
ShowHide solution
- (a) Curve (a) is a function, because every vertical line intersects the parabola at most once.
- (b) Curve (b) is not a function, because the dashed vertical line intersects the curve twice.
- (c) Curve (c) is not a function, because the dashed vertical line intersects the circle twice.
- (d) Curve (d) is a function, because the vertical line through the jump intersects the curve once, at the filled dot. The open dot marks a point left off the curve.
- (e) Curve (e) is not a function, because the curve lies on one vertical line, which intersects the curve at every point.
- (f) Curve (f) is a function, because every vertical line intersects the curve at most once.
Next: 2. Input, Output, and DomainLesson map
2. Input, Output, and Domain
Objective. Given a function, identify the output variable, the input variable(s), and the domain.
Definition 3 (Input variable).
The input variable is the variable whose values are the inputs of a function.
In the input variable is , the variable inside the parentheses. In , the letters , , and are not input variables, because they are constants: their values stay fixed while the input time varies.
Definition 4 (Output variable).
The output variable is the variable whose values are the outputs of a function.
In the output variable is , also written . The letter is not the output variable, because it names the function rather than its output values.
Definition 5 (Domain).
The domain is the set of input values of a function .
The number 1 is not in the domain of , because and is not a real number. The function has no output at 1.
The range is the set of output values of a function .
Example 4
The table gives the number of Twitter users, in millions, by quarter. Year counts years since 2000.
| Year | 11 | 11.25 | 11.5 | 11.75 | 12.75 |
| Users (millions) | 68 | 85 | 101 | 117 | 185 |
Identify the domain and range of the function the table defines.
ShowHide solution
By the definition of the domain, the domain is the set of inputs in the top row,
and the range is the set of outputs in the bottom row,
The domain excludes 12, because the table gives no output for 12.
Example 5
Identify the input variable and the output variable of each function:
ShowHide solution
- For , the input variable is and the output variable is .
- For , the input variable is time and the output variable is position.
- For , the input variable is and the output variable is .
Domain of a formula. When no domain is given, the domain of a function given by a formula is the set of real numbers at which the formula gives a real output.
Interval notation.
| every real number | |
| or |
A square bracket includes the endpoint, and a parenthesis leaves the endpoint out. Because no real number equals , an infinite end always takes a parenthesis. To join two intervals into one set, write the union symbol between them.
Finding a domain.
- Start from every real number.
- For each denominator, solve and remove those inputs.
- For each even root, keep only the inputs for which the expression under the root is non-negative.
- For each logarithm, keep only the inputs for which its argument is positive.
- Write the inputs that remain in interval notation.
Example 6
Identify the input variable, the output variable, and the domain of each function:
ShowHide solution
- For , the input variable is and the output variable is . The domain is , because the formula has no denominator, root, or logarithm.
- For , the input variable is and the output variable is height. The domain is , because cosine is defined for every real number.
- For , the input variable is and the output variable is . The domain is , because the denominator is 0 at .
Example 7
Identify the input variable, the output variable, and the domain of each function:
ShowHide solution
- For , the input variable is and the output variable is . A square root is an even root, and the expression under it must satisfy , that is, . The domain is , and 2 is included because .
- For , the input variable is and the output variable is . The argument of the logarithm must satisfy , that is, . The domain is , and 4 is left out because is undefined.
Example 8
Find the domain of the function
ShowHide solution
The power is a fourth root, an even root. The expression under it must be non-negative:
The domain is , and 3 is included because the fourth root of 0 is 0.
Next: 3. Function EvaluationLesson map
3. Function Evaluation
Objective. Evaluate a function at a given input, by hand and using R.
To evaluate at the input 2 by hand, replace every in the formula with 2. A negative input goes in parentheses: for , the value at is .
To evaluate in R, define with makeFun and type f(2) (Lesson 2 sheet, sections 4 and 5). Inside makeFun, the expressions , , , and are written log(x), exp(x), abs(x), and x^(1/n). For a negative , R returns NaN for x^(1/n), even when is odd (Lesson 1 sheet, section 2).
Example 9
For the function
evaluate , , and by hand and in R, then plot on .
ShowHide solution
Substituting each input into the formula gives
R defines , evaluates it at the same inputs, and plots it:
f = makeFun(2*x + 3 ~ x)
f(-1)
f(0)
f(2)
plotFun(f(x) ~ x, xlim = c(-2, 4))
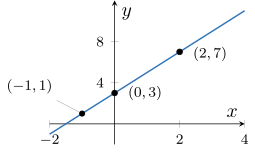
The three evaluations print [1] 1, [1] 3, and [1] 7, the same values as by hand. On the graph of , each evaluation is a point on the line: the input on the horizontal axis and the output above it, , , and .
Example 10
For the function
evaluate in R.
ShowHide solution
Define , writing as log, then evaluate it at 1.7:
w = makeFun(log(x^2 + 1) + 2*x ~ x)
w(1.7)
The last line prints [1] 4.758409, which gives . By hand with a calculator, the evaluation agrees:
Example 11
For the function
evaluate in R.
ShowHide solution
Define with makeFun as in Example 10, writing the cube root as the power, then evaluate it at 5.2:
v = makeFun(t^(1/3)*exp(-t/4) ~ t)
v(5.2)
The last line prints [1] 0.4721554, which gives .
The number in makeFun. Inside makeFun, a bare e becomes a second input, and a call with one input stops with an error:
> f = makeFun(e^x ~ x)
> f(1)
Error in f(1) : argument "e" is missing, with no default
Write as exp(x) in the definition.
Inputs outside the domain. R prints Inf, -Inf, or NaN at an input outside the domain, as the Lesson 1 sheet, section 2, and the Lesson 2 sheet, section 5, show.
Plotting window and domain. The range of the plotting window is the interval set with xlim, and the domain is the set of inputs the formula allows. A wider window on shows more of the graph, and the domain stays for every window. These two lines define and plot it on :
q = makeFun(1/(a - 5)^2 ~ a)
plotFun(q(a) ~ a, xlim = c(-2, 12))
Next: 4. Inverse FunctionsLesson map
4. Inverse Functions
Objective. Given a function, determine whether its inverse exists, and if so, find it.
The squadron rule of Example 1(a) run backwards asks, given a squadron, which cadet is in it. The reversed rule is not a function, because one squadron has many cadets.
Definition 6 (Inverse function).
The inverse function of maps each output from back to its corresponding input.
The rule that takes each output of back to an input is not an inverse function, because the output 4 has two corresponding inputs, 2 and . The definition maps each output back to one input.
Notation. The inverse of is written . The reciprocal is written , a different function from .
Existence. An inverse interchanges inputs and outputs. A function has an inverse function only if every output comes from exactly one input.
Criterion 7 (Horizontal line test).
A function has an inverse function if and only if every horizontal line intersects its graph at most once.
A function is monotonic if for every pair of inputs and with , or if for every such pair.
In a definition, the word “if” means “if and only if”.
A monotonic function passes the horizontal line test and has an inverse.
Graph of an inverse. Interchanging inputs and outputs moves the point on the graph of to the point on the graph of . The graph of is the graph of reflected across the line .
Example 12
Determine whether the function each table defines has an inverse.
(a) The function takes a year to its sales.
| Year | 2009 | 2010 | 2011 | 2012 |
| Sales ($ billions) | 121 | 143 | 168 | 192 |
(b) 1.15
| Input | 0 | 1 | 2 | ||
| Output | 4 | 1 | 0 | 1 | 4 |
ShowHide solution
- (a) By the definition of the inverse function, maps each sales figure back to its year. The function has an inverse, because each sales figure appears once and so comes from one year. The inverse takes the sales figure 168 back to its year: .
- (b) The function has no inverse, because the output 4 comes from the two inputs and 2.
Example 13
Use the horizontal line test to determine whether each function has an inverse.
(a)
(b)
(c)
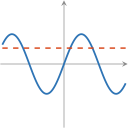
(d)
ShowHide solution
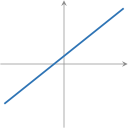
- (a) Function (a) has an inverse, because every horizontal line intersects the line at most once.
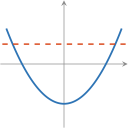
- (b) Function (b) has no inverse, because the dashed horizontal line intersects the parabola twice.
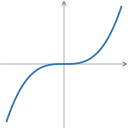
- (c) Function (c) has an inverse, because every horizontal line intersects the cubic at most once.
- (d) Function (d) has no inverse, because the dashed horizontal line intersects the sine wave three times.
Finding an inverse.
- Check with the horizontal line test that has an inverse.
- Solve for in terms of .
- Interchange the variables and .
Example 14
For the function
plot , determine whether has an inverse, and if so, find the inverse.
ShowHide solution
The function has an inverse, because is monotonic: its graph is a line with slope 3, which rises from left to right. To find the inverse, solve for :
Interchange and to write the inverse with input :
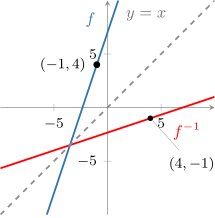
In R, the plot shows , its inverse in red, and the line dashed:
f = makeFun(3*x + 7 ~ x)
f_inverse = makeFun((x - 7)/3 ~ x)
plotFun(f(x) ~ x, xlim = c(-10, 10))
plotFun(f_inverse(x) ~ x, add = TRUE, col = "red")
plotFun(x ~ x, add = TRUE, col = "gray", lty = 2)
f_inverse(f(2))
The last line prints [1] 2, because and the inverse takes 13 back to the input 2. On the figure, the point on and the point on mirror each other across the line , because .
Example 15
For the function
plot , determine whether has an inverse, and if so, find the inverse.
ShowHide solution
Define , with the fifth root written as the power, and plot it:
g = makeFun((2*x - 3)^(1/5) ~ x)
plotFun(g(x) ~ x, xlim = c(-2, 4))
R’s plot shows only the right half of the curve, where . The left half is missing because R returns NaN for an odd root of a negative number. The missing half is drawn dashed in the figure.
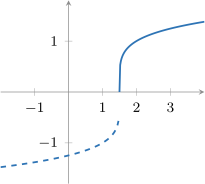
Desmos draws odd roots of negative numbers correctly. Check an odd root in Desmos before taking a shape or a domain from an R plot.
The function has an inverse, because is monotonic: as increases, increases, and so does its fifth root, as the full curve in the figure shows. To find the inverse, solve for , starting by raising both sides to the fifth power to undo the fifth root:
Interchange and to write the inverse with input :
Example 16
For the function
determine whether has an inverse. If it does, find the inverse and evaluate .
ShowHide solution
A plot of settles the horizontal line test, solving for gives the inverse, and R evaluates the inverse at 0.5. Plot :
r = makeFun((5*z - 3)/(7*z + 4) ~ z)
plotFun(r(z) ~ z, xlim = c(-3, 3))
The plot has two branches, one on each side of , where the denominator is 0. The function has an inverse, because every horizontal line intersects the graph at most once. Solve for :
The last step divides by , then multiplies the numerator and the denominator by . As in the textbook, a divisor that contains a variable is assumed to be nonzero. The algebra confirms the plot: each other than gives exactly one . Interchange and to write the inverse with input :
R defines the inverse and evaluates it at :
r_inverse = makeFun((4*z + 3)/(5 - 7*z) ~ z)
r_inverse(0.5)
The last line prints [1] 3.333333, which gives .
Example 17
For the function
find the inverse of and evaluate .
ShowHide solution
Plot for the horizontal line test, as in Example 16:
p = makeFun((x/2 + 1)/(x + 3) ~ x)
plotFun(p(x) ~ x, xlim = c(-8, 4))
The function has an inverse, because every horizontal line intersects the graph at most once. Multiply the numerator and the denominator by 2 to clear the inner fraction, then solve for :
The algebra confirms the plot: each other than gives exactly one . Interchange and to write the inverse with input :
R defines the inverse and evaluates it at :
p_inverse = makeFun((2 - 6*x)/(2*x - 1) ~ x)
p_inverse(0.25)
The last line prints [1] -1, which gives . As a check, at the numerator of is , the denominator is , and .