Limits and the Derivative
Objectives
- Understand when a limit exists; understand and write limit notation.
- Visually and numerically estimate a limit, or justify why it does not exist.
- Determine if a function is continuous at an input using the limit definition of continuity; understand that certain combinations of modeling functions are continuous on their domains.
- Understand and apply the limit definition of the derivative to estimate a derivative at a given input.
1. Limits
Objective. Understand when a limit exists; understand and write limit notation.
Definition 1 (Limit).
The limit of a function as the variable approaches a number is the number that the outputs of approach as the inputs get close (but not necessarily equal) to from both the left and the right, and is denoted by . If does not approach a unique number, then does not exist. The notation reads “the limit of as approaches 2 is 15.”
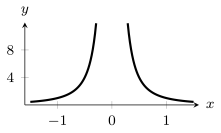
The function has no limit as approaches 0. Its outputs , , and rise without bound, and the definition requires the outputs to approach a unique number.
Dots on a graph. A filled dot at marks the value , and an open dot at marks a point missing from the graph.
Limit and function value. The limit does not depend on . Each graph below shows a function whose outputs approach 3 as approaches 2. In all three, .
Value equal to the limit
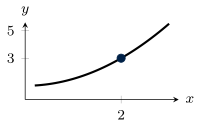
The filled dot on the curve gives , the same number as the limit.
Value different from the limit
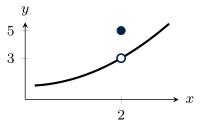
The filled dot above the curve gives , and the limit is still 3.
Undefined value
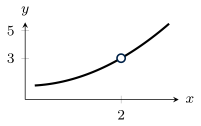
The open dot marks as undefined, and the limit is still 3.
The left-hand limit of a function as approaches is the number that the outputs of approach as the inputs get close to through values less than , and is denoted by .
The right-hand limit of a function as approaches is the number that the outputs of approach as the inputs get close to through values greater than , and is denoted by .
Limit notation. Each notation reads as follows.
| Notation | Reading |
| the limit of as approaches | |
| the left-hand limit of as approaches | |
| the right-hand limit of as approaches |
Theorem 2 (Existence of a limit).
The limit exists exactly when the left-hand limit and the right-hand limit both exist and are equal.
Example 1
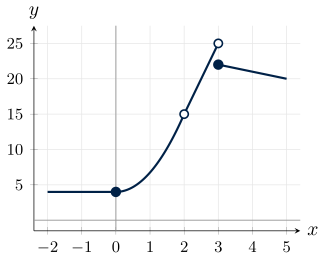
Evaluate each limit using the graph of , or explain why the limit does not exist:
ShowHide solution
- By the definition of a limit, equals 4, because the outputs approach 4 as the inputs approach 0 from both the left and the right.
- The limit equals 15, because the outputs approach 15 as the inputs approach 2 from both sides. The value is undefined, because the graph has an open dot at .
- The limit does not exist, because , at the open dot, and , at the filled dot, are different numbers.
Example 2
A parking garage charges dollars to park for hours. As approaches 2 through times less than 2 hours, the charge approaches 10 dollars. As approaches 2 through times greater than 2 hours, the charge approaches 15 dollars. Write both statements in limit notation, and determine whether exists.
ShowHide solution
By the definitions of the left-hand and right-hand limits, the two statements are
The first reads “the left-hand limit of as approaches 2 is 10.” By the existence of a limit theorem, does not exist, because the one-sided limits 10 and 15 are different numbers. Near 2 hours the charge approaches no single amount: it jumps by 5 dollars at 2 hours.
2. Estimating a Limit
Objective. Visually and numerically estimate a limit, or justify why it does not exist.
Limit from a graph.
- Trace the graph toward from the left and read the height it approaches.
- Trace the graph toward from the right and read the height it approaches.
- Compare the two heights. Equal heights give the limit, and different heights mean the limit does not exist. A graph that rises or falls without bound on either side approaches no height, and the limit does not exist.
A limit that does not exist. The two graphs show the two ways a limit fails to exist in this course.
Different one-sided limits
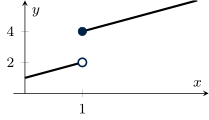
The limit as approaches 1 does not exist, because the outputs approach 2 from the left and 4 from the right.
Outputs without bound
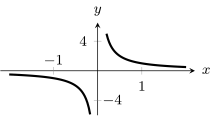
The limit as approaches 0 does not exist, because the outputs of rise without bound to the right of and fall without bound to the left.
Example 3
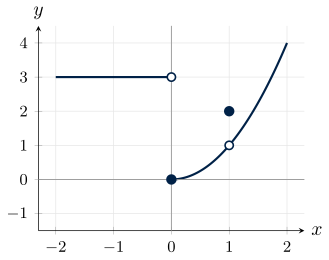
Evaluate each limit using the graph of , or explain why the limit does not exist:
ShowHide solution
- The limit equals 3, because the graph is level at height 3 on both sides of .
- The limit does not exist, because and are different numbers.
- The limit equals 1, because the outputs approach 1 as the inputs approach 1 from both sides. The filled dot gives .
Limit from a formula.
- Choose inputs on each side of , such as , , and on the left and , , and on the right.
- Evaluate the function at each input.
- Compare the outputs. If the outputs on each side approach one number as the inputs get closer to , and the two sides agree, then that number is the estimate of the limit. If the two sides approach different numbers, or the outputs rise or fall without bound, then the limit does not exist.
Example 4
Numerically approximate the limit in R, with in radians:
ShowHide solution
Define and evaluate it at inputs on each side of and at itself. Used R.
g = makeFun(sin(x)/x ~ x)
g(c(-0.1, -0.01, -0.001))
[1] 0.9983342 0.9999833 0.9999998
g(c(0.1, 0.01, 0.001))
[1] 0.9983342 0.9999833 0.9999998
g(0)
[1] NaN
R returns the three outputs in the order of the inputs inside c(). It returns NaN (not a number) for g(0), because is undefined. The outputs at and all round to 1.000, from both the left and the right. The numerical estimate of the limit is
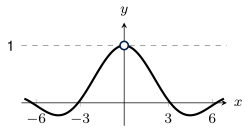
On the graph of , the curve approaches the dashed line at height 1 from both sides of , and the open dot at marks the point missing from the graph.
Example 5
Numerically approximate the limit in R, or justify why it does not exist:
ShowHide solution
Evaluate on each side of , as in Example 4. Used R.
s = makeFun(abs(x)/x ~ x)
s(c(-0.1, -0.01, -0.001))
[1] -1 -1 -1
s(c(0.1, 0.01, 0.001))
[1] 1 1 1
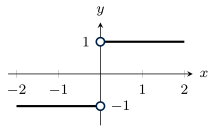
The limit does not exist, because the outputs approach from the left and from the right. For every with , and . For every with , and . The graph jumps from height to height 1 at .
3. Continuity
Objective. Determine if a function is continuous at an input using the limit definition of continuity; understand that certain combinations of modeling functions are continuous on their domains.
Definition 3 (Continuous).
A function is continuous at if and only if
At an endpoint of the domain, such as for , the limit is the one-sided limit from inside the domain. A function is continuous on its domain exactly when is continuous at every input in its domain.
The function is not continuous at . Its limit there exists, because for every with ,
As approaches 1, the outputs approach , and . The value is undefined, because substituting gives . The definition requires the limit to equal . Therefore is not continuous at .
Criterion 4 (Continuity).
A function is continuous at exactly when all three conditions are true:
- The value is defined.
- The limit exists.
- The limit equals .
As in the definition, at an endpoint of the domain the limits in the second and third conditions are one-sided.
A function is continuous on an interval when it is continuous at every input in the interval, and its graph over that interval can then be drawn without lifting the pen.
Failed conditions. Each function graphed below is not continuous at , and the first condition to fail is a different one in each.
Undefined value
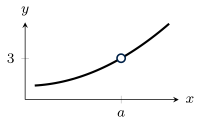
The first condition fails: the open dot marks as undefined.
Limit nonexistent
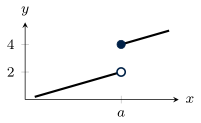
The second condition fails: the one-sided limits 2 and 4 differ.
Value different from the limit
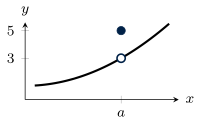
The third condition fails: the limit 3 differs from .
Example 6
Use the graph of to determine whether is continuous at , at , and at .
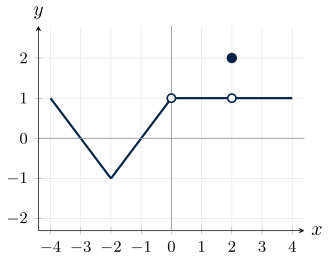
ShowHide solution
- By the definition of continuous, is continuous at , because equals , the height of the corner at .
- The function is not continuous at , because is undefined: the graph has an open dot at .
- The function is not continuous at , because and are not equal.
Theorem 5 (Continuous functions).
- Linear, exponential, power, trigonometric, and sigmoidal functions are continuous on their domains.
- A function built from the common modeling functions by sums, differences, products, quotients, and one function inside another is continuous on its domain.
The natural logarithm is also continuous on its domain. An input that makes a denominator zero, or puts zero or a negative number into a logarithm, lies outside the domain of a combination of common modeling functions. So does an input that puts a negative number under an even root, such as a square root.
For a piecewise function whose pieces are continuous on their intervals, check the three conditions at each boundary between pieces.
If is continuous at , then substituting into gives .
Example 7
Identify where each function is continuous:
ShowHide solution
- By the continuous functions theorem, is continuous on , the inputs where both of its terms are continuous. The function , a sine inside an exponential, is continuous on all real numbers. The power function has domain , because a square root of a negative number and division by zero are both undefined, and it is continuous on that domain.
- By the continuous functions theorem, is continuous on all real numbers except , because it is a quotient of continuous functions and at .
Because both pieces of are linear, is the only input to check. The one-sided limits at are
The limit does not exist, because the one-sided limits differ. Therefore is continuous on all real numbers except .
Example 8
Identify where the function is continuous:
ShowHide solution
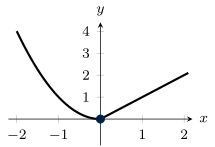
Because both pieces are continuous, is the only input to check against the continuity criterion. The first condition is true, because from the piece for . Substituting into each continuous piece gives the one-sided limits and . By the existence of a limit theorem, , and this limit equals . The second and third conditions are true. Therefore is continuous on all real numbers. On the graph, the parabola from the left and the line from the right meet at , and the graph can be drawn without lifting the pen.
4. Limit Definition of the Derivative
Objective. Understand and apply the limit definition of the derivative to estimate a derivative at a given input.
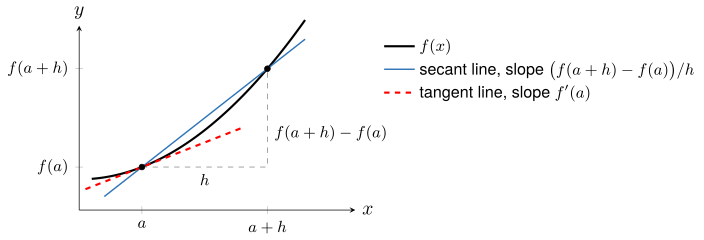
The secant line through and has slope , the average rate of change of over the interval between and (Lesson 25 Notes, section 1). As approaches 0, the point slides along the graph toward , and, when exists, the secant line approaches the tangent line. A positive gives an interval to the right of , and a negative gives an interval to the left of .
Definition 6 (Limit definition of the derivative).
By the limit definition of the derivative, the derivative of a function for input is
The derivative is the instantaneous rate of change of when (Lesson 25 Notes, section 3). It exists only when, as approaches 0, the average rates of change from both sides of approach the same number.
The function of Example 7, equal to 2 for and to for , has no derivative when . The piece gives its value there, . For every with , the average rate of change in the definition is
which rises without bound as approaches 0 from the left. The definition requires the average rate of change to approach a number.
Estimating a derivative.
- Substitute the function and the input into the definition.
- Compute the average rate of change for values of on both sides of 0 that shrink by a factor of 10, such as , , and .
- Apply the stopping test from the Lesson 25 Notes, section 2: stop at a step where, to three decimals, the rates for and agree with each other and with the rates on the step before.
- Report the number the average rates of change approach from both sides, with units. If the two sides approach different numbers, or the rates rise or fall without bound, then the derivative does not exist.
Example 9
Write the limit definition of and use it to estimate in R:
ShowHide solution
By the limit definition of the derivative,
Calculate , the value subtracted in the numerator:
Substitute , , and into the limit definition of the derivative:
Compute the average rate of change in the definition for , , and . Used R.
f = makeFun(3*x^2 - 2*x ~ x)
h = c(0.001, 0.0001, 0.00001, -0.001, -0.0001, -0.00001)
(f(2 + h) - f(2))/h
[1] 10.00300 10.00030 10.00003  9.99700  9.99970  9.99997
The line h = c(...) stores the six values of . The line (f(2 + h) - f(2))/h computes the average rate of change in the definition for each one, and R prints the six quotients in the same order, the three positive values of first. At the average rates of change round to 10.003 and 9.997. At and at all four round to 10.000. The stopping test is met:
Example 10
The median home price in the United States, in thousands of dollars, in year from 2001 to 2010 is modeled by
Estimate in R using the limit definition of the derivative, and explain what the value means.
ShowHide solution
The limit definition of the derivative when is
Estimate the limit as in Example 9, with , , and . Used R.
P = makeFun(0.17*(Y - 2001)^4 - 3.2*(Y - 2001)^3 +
16.7*(Y - 2001)^2 - 10.9*(Y - 2001) + 177.7 ~ Y)
h = c(0.0001, 0.00001, 0.000001, -0.0001, -0.00001, -0.000001)
(P(2005 + h) - P(2005))/h
[1] 12.61946 12.61995 12.62000 12.62054 12.62005 12.62001
At the average rates of change round to 12.619 and 12.621. At and at all four round to 12.620. The stopping test is met:
The units are thousand dollars per year, and the dimension is . Based on the model, the median home price was increasing at about $12,620 per year in 2005.
Example 11
Use the limit definition of the derivative, with average rates of change computed in R, to show that does not exist:
ShowHide solution
Substituting and into the limit definition of the derivative gives
the limit of Example 5 with in place of . Compute the average rate of change for , , and . Used R.
f = makeFun(abs(x) ~ x)
h = c(0.1, 0.01, 0.001, -0.1, -0.01, -0.001)
(f(0 + h) - f(0))/h
[1]  1  1  1 -1 -1 -1
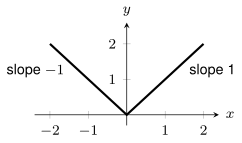
The average rates of change equal 1 for positive , because there, and for negative , because there. Because they approach different numbers from the two sides, does not exist. The graph of shows the same fact as a corner at , where the slope is on the left and 1 on the right.
Found a mistake, a broken tool or something unclear? Report a problem