The Derivative as a Function II
Objectives
- Describe differentiable and identify at what inputs a function is or is not differentiable.
- Given a function, use R to approximate and plot its first and higher-order derivatives.
- Given a first derivative, identify where the function is increasing or decreasing and identify local extrema.
- Given a first or second derivative, determine concavity and identify inflection points.
1. Differentiability
Objective. Describe differentiable and identify at what inputs a function is or is not differentiable.
Definition 1 (Differentiable).
A function is differentiable at if and only if the derivative exists. A function is differentiable on an interval if and only if is differentiable at every input in the interval.
The function is not differentiable at , because the derivative does not exist. Its average rates of change approach 1 from the right and from the left (Lesson 26 Notes, Example 11).
Graphical features that correspond to a function being nondifferentiable are sharp points, including corners and cusps, as well as breaks in the graph, including holes, jumps, and vertical asymptotes. Each graph below is the graph of a function with one feature at .
Corner
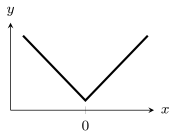
The slopes on the two sides of are different numbers, and 1.
Cusp
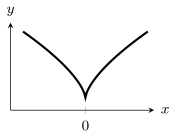
The graph comes to a sharp point, and near the slopes grow without bound in size.
Hole
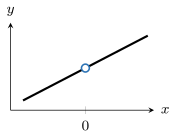
The derivative does not exist, because is undefined and the limit definition of the derivative uses .
Jump
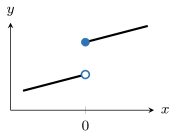
The filled dot is , and the outputs from the left approach a lower value. Over a short interval on the left, the change in output stays near the height of the jump while the interval’s length shrinks toward 0. Their quotient, the average rate of change, grows without bound.
Vertical asymptote
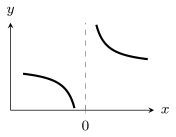
The function has no output at , and near its outputs grow without bound in size.
Example 1
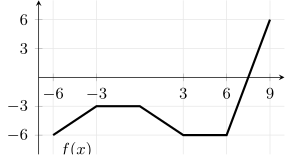
Sketch the graph of the derivative of the function graphed below, and identify the inputs with where is not differentiable.
ShowHide solution
By the definition of differentiable, is differentiable at exactly when exists. On each of the five line segments, is the slope of the segment:
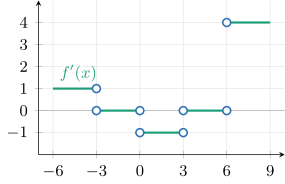
Each slope is the rise over the run, such as on the last segment. At , every interval with gives an average rate of change of , and every interval with gives . Because the left and right average rates of change approach different numbers, does not exist. The slopes on the two sides of , , and also differ. Therefore, is not differentiable at , , , and . The graph beside this text is the sketch of : one horizontal segment at the height of each slope, with open dots at the four inputs where does not exist.
Example 2
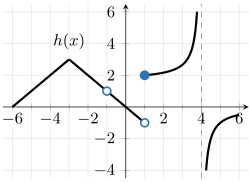
Identify the inputs with where the function graphed below is not differentiable, and name the graphical feature at each one.
ShowHide solution
The function is not differentiable at , , , and .
- The graph of has a corner at , because the slope of is on the left and on the right.
- The graph of has a hole at , because the outputs approach from both sides and is undefined.
- The graph of has a jump at , because the outputs approach from the left and from the right.
- The graph of has a vertical asymptote at , because the outputs grow without bound as approaches from the left and fall without bound from the right.
2. Higher-Order Derivatives in R
Objective. Given a function, use R to approximate and plot its first and higher-order derivatives.
Definition 2 (Second and higher-order derivatives).
The second derivative of a function is the derivative of . In general, means , and for each integer with , the th derivative of is the derivative of . The derivatives with are the higher-order derivatives of .
The function has no second derivative at , because does not exist. The derivative is for and 1 for , and the derivative of at uses the value .
Compared with the dimension of , the dimension of has one more factor of :
The Lesson 25 Notes, section 1, give the units of a rate of a rate, such as an acceleration in m/s with dimension .
Example 3
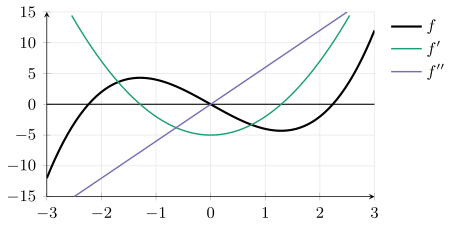
Use R to approximate and plot the first and second derivatives of
on , and estimate and .
ShowHide solution
By the definition of the second derivative, is the derivative of . Define and the step-0.001 approximation f_deriv of . The function f_deriv2 applies the same approximation to f_deriv and so approximates . Plot all three on . Used R.
f = makeFun(x^3 - 5*x ~ x)
plotFun(f(x) ~ x, xlim = range(-3, 3), col = "black")
f_deriv = makeFun((f(x + 0.001) - f(x))/0.001 ~ x)
f_deriv2 = makeFun((f_deriv(x + 0.001) - f_deriv(x))/0.001 ~ x)
plotFun(f_deriv(x) ~ x, col = "darkgreen", add = TRUE)
plotFun(f_deriv2(x) ~ x, col = "purple", add = TRUE)
In the plot, the black cubic is , the green parabola is , and the purple line is . The parabola crosses the -axis at the inputs where the cubic has slope 0, and the line crosses the -axis at , where the parabola has slope 0.
Evaluate both approximations at . Used R.
f_deriv(2)
[1] 7.006001
f_deriv2(2)
[1] 12.006
The step-0.001 values 7.006 and 12.006 are first estimates. To find and to three decimals, apply the stopping test of the Lesson 25 Notes, section 2: shrink the step on both sides of until the third decimal stops changing.
The second expression below repeats the computation of f_deriv2 with step . Its part (f(2 + 2*h) - f(2 + h))/h is the first-derivative estimate at , and (f(2 + h) - f(2))/h is the first-derivative estimate at 2. Their difference divided by is the average rate of change of the first-derivative estimates from 2 to , which approximates . The three negative entries of h are steps to the left of 2. Used R.
h = c(0.0001, 0.00001, 0.000001, -0.0001, -0.00001, -0.000001)
(f(2 + h) - f(2))/h
[1] 7.000600 7.000060 7.000006 6.999400 6.999940 6.999994
((f(2 + 2*h) - f(2 + h))/h - (f(2 + h) - f(2))/h)/h
[1] 12.00060 12.00004 11.99751 11.99940 11.99997 11.99840
The first-derivative estimates round to from both sides at steps 0.00001 and 0.000001. The stopping test is met:
The second-derivative estimates round to from both sides at step 0.00001, and at step 0.000001 they drift to . At so small a step, the rounding error in R’s stored outputs of is divided by twice in the formula, and the result is large enough to change the third decimal. The stopping test therefore does not confirm . The step-0.00001 estimates come before that drift, and they give the estimate:
Example 4
The height in meters of a ball thrown straight up, seconds after release, is
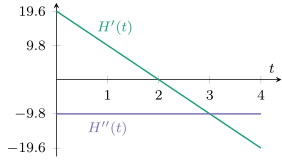
Use R to approximate and with step 0.001, give the units of each, and plot and for .
ShowHide solution
Define and the step-0.001 approximation H_deriv of , then H_deriv2, which applies the same approximation to H_deriv. Evaluate both at , then plot both. Used R.
H = makeFun(19.6*t - 4.9*t^2 ~ t)
H_deriv = makeFun((H(t + 0.001) - H(t))/0.001 ~ t)
H_deriv2 = makeFun((H_deriv(t + 0.001) - H_deriv(t))/0.001 ~ t)
H_deriv(1)
[1] 9.7951
H_deriv2(1)
[1] -9.8
plotFun(H_deriv(t) ~ t, xlim = range(0, 4), col = "darkgreen")
plotFun(H_deriv2(t) ~ t, col = "purple", add = TRUE)
At step 0.001 the error of the estimate of shows in the second decimal. Report it to one decimal:
The derivative is the ball’s velocity, in meters per second. The second derivative is the rate of change of the velocity, in meters per second per second, written m/s, with dimension . One second after release, the height is increasing at about 9.8 m/s, and the velocity is decreasing at about 9.800 m/s.
In the plot, the green line falls from about 19.6 to about . The purple line stays at height at every time.
Third and higher derivatives in R. To approximate each further derivative in R, apply the same step-0.001 formula to the approximation of the derivative before it. The line below defines an approximation of the third derivative , also written .
f_deriv3 = makeFun((f_deriv2(x + 0.001) - f_deriv2(x))/0.001 ~ x)
Order of the R lines. The function f_deriv2 calls f_deriv, and f_deriv calls f. Evaluating or plotting f_deriv2 before f_deriv is defined gives an error:
> f_deriv2(1)
Error in f_deriv(x + 0.001) : could not find function "f_deriv"
3. Increasing, Decreasing, and Local Extrema
Objective. Given a first derivative, identify where the function is increasing or decreasing and identify local extrema.
Theorem 3 (Derivative and monotonicity).
If for every in an interval, then is increasing on that interval. If for every in an interval, then is decreasing on that interval. If for every in an interval, then is constant on that interval.
Definition 4 (Local extrema).
For a function and a real number in its domain, a local maximum is a value such that for all inputs near input .
For a function and a real number in its domain, a local minimum is a value such that for all inputs near input .
A local extremum is a local maximum or a local minimum of .
The plural is local extrema.
The value of is not a local extremum, because the definition requires for every nearby input, or for every nearby input. Every interval around contains inputs with , where , and inputs with , where .
Theorem 5 (Sign test for local extrema).
Let be continuous at an input . If changes from positive to negative at , then is a local maximum. If changes from negative to positive at , then is a local minimum. If has the same sign on both sides of , then has no local extremum at .
A function that is differentiable at an input is continuous there. The sign test therefore applies at every input where exists.
Each graph below shows near an input , with the sign of on each side.
Local maximum
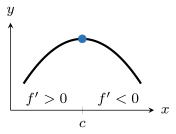
The graph rises to and then falls, and is a local maximum.
Local minimum
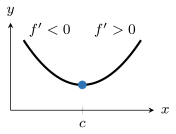
The graph falls to and then rises, and is a local minimum.
No local extremum
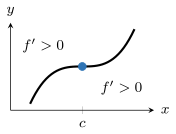
The graph rises on both sides of , and is neither a local maximum nor a local minimum.
Breaks in the graph. The sign test for local extrema applies only where is continuous. The function in Example 2 falls to the left of its jump at and rises to the right. The value is neither a local maximum nor a local minimum, because the outputs just left of are near and the outputs just right of are above .
Intervals and local extrema from .
- Find the inputs where or where does not exist.
- Evaluate at one test input inside each interval those inputs mark off.
- Label each interval increasing or decreasing by the sign of its test value.
- At each input where is continuous, report a local maximum where changes from positive to negative and a local minimum where changes from negative to positive.
Example 5
The derivative of is
Identify where is increasing or decreasing, and identify its local extrema.
ShowHide solution
Because the derivative exists at every input, is continuous everywhere, and the sign test for local extrema applies at every input. Find the inputs where by setting :
Evaluate at one test input in each of the three intervals those inputs mark off:
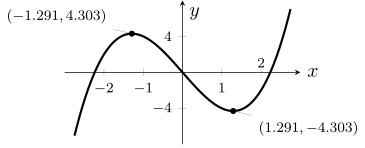
Therefore, is increasing on and and decreasing on . Because the sign of changes from positive to negative at , has a local maximum there. By the definition of local extrema, the local maximum is the value :
Because the sign of changes from negative to positive at , has a local minimum there, and the local minimum is the value :
On the graph of , the local maximum, about 4.303, is the height of the peak at about , and the local minimum, about , is the height of the valley at about .
Example 6
The derivative of a function is
Identify where is increasing or decreasing, and identify the inputs of its local extrema.
ShowHide solution
The derivative is zero at and , where the factors and are zero. Evaluate at a test input in each interval, as in Example 5:
Therefore, is decreasing on and and increasing on . Because the derivative exists at every input, is continuous everywhere. The function has a local minimum at , because changes from negative to positive there. The function has no local extremum at , because is negative on both sides.
A rising graph of below the -axis. A graph of that rises can be misread as a sign that is increasing. On , the graph of from Example 5 rises while its values stay negative. The function is decreasing on , because for every in that interval.
4. Concavity and Points of Inflection
Objective. Given a first or second derivative, determine concavity and identify inflection points.
Concave up
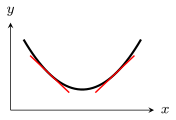
The red segments are tangent lines. Where , their slopes increase from left to right, and the graph bends upward.
Concave down
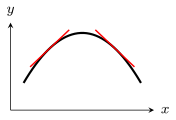
The red segments are tangent lines. Where , their slopes decrease from left to right, and the graph bends downward.
Point of inflection
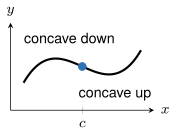
The graph changes from concave down to concave up at , where changes sign.
Definition 6 (Concavity).
For a function differentiable on the interval , is concave up on if and only if is increasing on .
For a function differentiable on the interval , is concave down on if and only if is decreasing on .
For a differentiable function, these definitions of concave up and concave down agree with the definitions in the Lesson 5 Notes.
On every interval, the line is neither concave up nor concave down, because the definitions require to increase or to decrease and its derivative is the constant slope .
Definition 7 (Point of inflection).
The point is a point of inflection of if and only if changes concavity at input .
The point on the graph of is not a point of inflection, because the definition requires a change of concavity and the graph is concave up on both sides of .
Theorem 8 (Second derivative and concavity).
If for every in an interval, then is concave up on that interval. If for every in an interval, then is concave down on that interval. If changes sign at an input and is continuous at , then is a point of inflection of .
The first two sentences of the theorem follow from the derivative and monotonicity theorem with in place of , together with the definition of concavity. Where , the derivative is increasing, and by the definition of concavity, is concave up. Where , the derivative is decreasing, and is concave down.
Concavity and points of inflection from .
- Find the inputs where or where does not exist.
- Evaluate at one test input inside each interval those inputs mark off.
- Label each interval concave up or concave down by the sign of its test value.
- Report a point of inflection at each input where the sign of changes and is continuous.
Example 7
The second derivative of is
Determine the concavity of and identify its points of inflection.
ShowHide solution
By the definition of concavity, is concave up on an interval where increases, and increases on each interval where . Likewise, is concave down on an interval where decreases, and decreases on each interval where . The second derivative is zero at . Evaluate it at one test input on each side:
Thus, is concave down on and concave up on . The concavity changes at , and the output there is
By the definition of a point of inflection, the point is a point of inflection of .
Example 8
The second derivative of a function satisfies
Determine whether each statement must be true:
- The derivative is increasing on .
- The function is concave up on .
- The function is increasing on .
ShowHide solution
The first statement must be true by the derivative and monotonicity theorem applied to , because on . The second statement must be true by the definition of concavity, because is increasing on . The third statement need not be true, because whether is increasing on depends on the sign of there, and only the sign of is given.
Example 9
The second derivative of a function is
Determine the concavity of and identify its points of inflection.
ShowHide solution
The second derivative is zero only at and positive at every other input, because the square of a nonzero number is positive. The derivative therefore increases on and on . Because exists, is continuous at and increases across as well. By the definition of concavity, is concave up on . The function has no point of inflection, because the concavity is the same on both sides of and the definition of a point of inflection requires a change of concavity.
Example 10
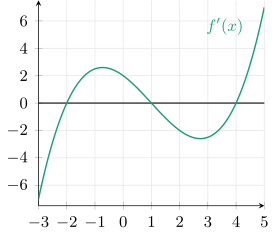
The graph below shows the derivative of a function on . For , identify where is increasing or decreasing, the inputs of its local extrema, its concavity, and the inputs of its points of inflection.
ShowHide solution
The graph of is below the -axis on and and above the -axis on and . Therefore, is decreasing on and and increasing on and . Because the derivative exists at every input of the graph, is continuous there. The function has local minima at and , where the sign of changes from negative to positive. The function has a local maximum at , where the sign changes from positive to negative.
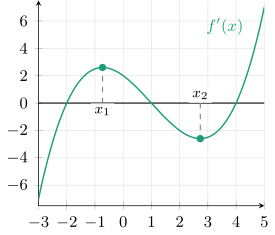
On the graph, has a local maximum at an input between and 0 and a local minimum at an input between 2 and 3. The graph of rises on and and falls on . As a result, is concave up on and and concave down on . The function has points of inflection at the inputs and , because the concavity changes at each one.
The graph of gives the inputs of the local extrema and the points of inflection of . To find the values of the local extrema and the heights of the points of inflection, use a formula or a graph of .
Found a mistake, a broken tool or something unclear? Report a problem