The Derivative as a Function I
Objectives
- Describe that in general, the derivative of a function is also a function.
- Given a function, use R to approximate and plot its derivative.
- Given the plot of a function, approximate its derivative graphically by hand.
1. Derivative Function
Objective. Describe that in general, the derivative of a function is also a function.
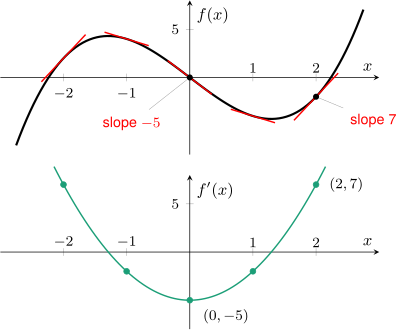
The top graph shows with its tangent line at five inputs, each slope estimated as in the Lesson 25 Notes, section 2. The bottom graph shows the slope of each tangent line as a height at the same input. The tangent line at has slope 7, plotted as the point . The tangent line at has slope , plotted as the point . Every input of gives one slope, and plotting the slope at every input gives the green curve, the graph of the derivative function.
Definition 1 (Derivative function).
Let be a function. The derivative function outputs the instantaneous rate of change of for each input where that rate exists.
The number is not a derivative function. It is one output of , the instantaneous rate of change at the single input , and the definition requires an output for each input where that rate exists.
| Expression | Kind of object | Meaning |
|---|---|---|
| a number | the slope of the graph of at | |
| a function | assigns to each input the slope of the graph of at , where the slope exists | |
| a function | the same function as , read “ of of ” |
Example 1
For the function
the average rate of change on approximates and takes these values at five inputs:
| rate on |
Is the derivative of a function?
ShowHide solution
By the definition of the derivative function, outputs the instantaneous rate of change of for each input where that rate exists. The derivative of is a function, because each input has exactly one instantaneous rate of change. The table gives estimates of at five inputs, and the rate changes with the input: is near while is near . Each column of the table is a point near the green curve in the figure above, such as near .
Example 2
The height in meters of a ball thrown straight up, seconds after release, is
The average rate of change on approximates and takes these values:
| rate on |
Describe as a function: give its input and its output with units, and say what the table shows about the ball.
ShowHide solution
The derivative function takes as input a time in seconds and outputs the instantaneous rate of change of the height at that time, in meters per second. The derivative is a function of , because each time has exactly one instantaneous rate of change. The estimates decrease from about 19.595 meters per second at release to about meters per second at . The height increases at a decreasing rate until . At the estimate is meters per second, a change in height of about 5 millimeters per second, against about 9.8 meters per second at and at . Therefore , and the ball is at or very near the top of its flight at . After the rate is negative and the height decreases.
2. Approximating the Derivative in R
Objective. Given a function, use R to approximate and plot its derivative.
Approximating a derivative in R.
- Define the function:
f = makeFun(x^3 - 5*x ~ x). - Define the approximate derivative, the average rate of change from to :
f_deriv = makeFun((f(x + 0.001) - f(x))/0.001 ~ x). - Evaluate
f_deriv(a)to approximate . - Plot with
plotFun, then add the approximate derivative on top withplotFun(f_deriv(x) ~ x, add = TRUE).
Approximate derivative from f_change. After f_change from section 1 of the Lesson 25 Notes is defined, the line
f_deriv = makeFun(f_change(x, x + 0.001) ~ x)
also defines f_deriv, because f_change(x, x + 0.001) is the average rate of change on .
Step size. The step is the width of the interval . For the functions in this course, shrinking a step of 0.001 down to about 0.000001 brings the average rate of change on closer to , or leaves it equal to when is linear. Far smaller steps can make the estimate worse, because R rounds each output before subtracting.
For and a step , with , the average rate of change on simplifies to
which approaches as approaches . The table gives the estimate at three steps:
| step | |||
| estimate of |
Answers to three decimals. The estimate with step 0.001 can be wrong in the third decimal or earlier: at it rounds to , while . For an answer to three decimals, shrink the step by a factor of 10 at a time with f_change until the stopping test in the Lesson 25 Notes, section 2, is met. When a problem gives the interval or the step, use that interval or step.
Order of definitions. The function f_deriv uses f. Evaluating f_deriv before f is defined gives an error:
> f_deriv(1)
Error in f(x + 0.001) : could not find function "f"
When f_deriv is defined from f_change, evaluating f_deriv before f_change is defined gives this error:
> f_deriv(1)
Error in f_change(x, x + 0.001) : could not find function "f_change"
Example 3
Approximate in R for the function
and plot the approximate derivative on top of for .
ShowHide solution
Define , the average rate of change f_change, and the approximate derivative f_deriv with step 0.001. Evaluate f_deriv(1), then shrink the step on each side of with f_change until the stopping test is met. Used R.
f = makeFun(x^3 - 5*x ~ x)
f_change = makeFun((f(b) - f(a))/(b - a) ~ a & b)
f_deriv = makeFun((f(x + 0.001) - f(x))/0.001 ~ x)
f_deriv(1)
[1] -1.996999
f_change(1, 1.001)
[1] -1.996999
f_change(1, 1.0001)
[1] -1.9997
f_change(0.9999, 1)
[1] -2.0003
f_change(1, 1.00001)
[1] -1.99997
f_change(0.99999, 1)
[1] -2.00003
The call f_change(1, 1.001) returns the same as f_deriv(1), because both compute the average rate of change on . At steps 0.0001 and 0.00001 the rates from both sides all round to . The stopping test is met, and to three decimals
Plot for , then add the approximate derivative f_deriv on top. Used R.
plotFun(f(x) ~ x, xlim = range(-3, 3), ylim = range(-13, 23))
plotFun(f_deriv(x) ~ x, col = "darkgreen", add = TRUE)
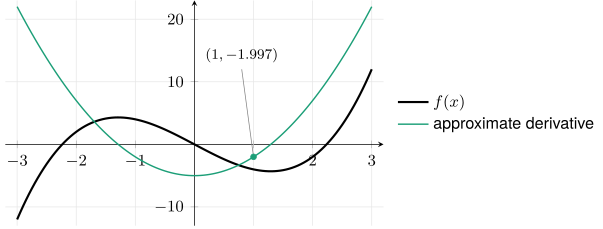
The first line plots , and the second adds the plot of f_deriv in green. The green curve passes through , whose height is the value f_deriv(1) returned, and its height at each input is approximately the slope of the black curve there.
Example 4
The function Weight models the average weight in grams of a male fetus, with input Week, the gestational age in weeks:
Use R to approximate with step 0.001, and plot the approximate derivative for weeks 20 to 35.
ShowHide solution
Define Weight and the approximate derivative Weight_deriv with step 0.001, the average rate of change from Week to . Evaluate it at week 30 and at the ends of the plot, then plot it. Used R.
Weight = makeFun(781.9*exp(0.1216*(Week - 25)) ~ Week)
Weight_deriv = makeFun((Weight(Week + 0.001) - Weight(Week))/0.001 ~ Week)
Weight_deriv(30)
[1] 174.6474
Weight_deriv(c(20, 35))
[1]  51.76785 320.78443
plotFun(Weight_deriv(Week) ~ Week, xlim = range(20, 35))
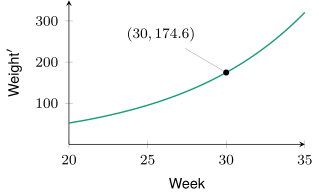
The line Weight_deriv(30) computes , which approximates . At step 0.001 the error of this estimate shows in the second decimal. Report the estimate to one decimal:
In week 30, the average male fetus’s weight is increasing at about 174.6 grams per week. The plot rises from about 51.8 grams per week at week 20 to about 320.8 grams per week at week 35. Because the approximate derivative increases, the weight increases at a greater rate each week.
Example 5
For the function
use R to determine whether is positive or negative, and whether is increasing or decreasing at .
ShowHide solution
Define and evaluate it at . Used R.
f = makeFun(x^3 - 5*x ~ x)
f(1.5)
[1] -4.125
The value is negative.
The sign of determines whether is increasing or decreasing. Approximate with the approximate derivative, as in Example 3, and check it with the average rates of change on each side of at step 0.0001. Used R.
f_deriv = makeFun((f(x + 0.001) - f(x))/0.001 ~ x)
f_change = makeFun((f(b) - f(a))/(b - a) ~ a & b)
f_deriv(1.5)
[1] 1.754501
f_change(1.5, 1.5001)
[1] 1.75045
f_change(1.4999, 1.5)
[1] 1.74955
The rates from both sides of are positive and close to the estimate 1.754501, far from 0. Therefore is positive, and is increasing at . Because the question asks only for the sign, the work stops without a three-decimal estimate or stopping test.
3. Sketching the Derivative from a Graph
Objective. Given the plot of a function, approximate its derivative graphically by hand.
The value is the slope of the tangent line to the graph of at . The first four graphs show with one or two tangent lines. The last graph shows , whose graph has a corner.
Positive derivative
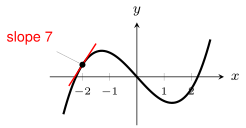
The graph rises left to right at , and is positive.
Negative derivative
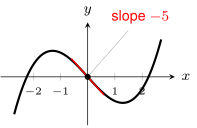
The graph falls left to right at , and is negative.
Zero derivative
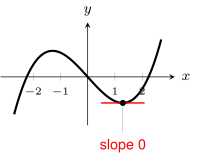
The graph has a valley near , where the green approximate derivative of Example 3 crosses 0. The tangent line is horizontal there, and .
Size of the derivative
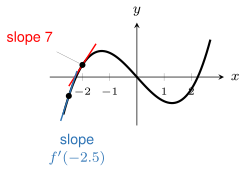
Because the blue tangent line at is steeper than the red one at , is farther from zero than .
Undefined derivative
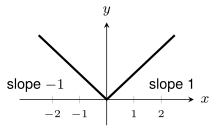
The graph of has a corner at with no single tangent line, and is undefined.
Sketching a derivative.
- Mark each input where the graph of has a horizontal tangent line. The derivative is zero there.
- Draw above the -axis where rises and below where falls.
- Estimate the slope of the graph of at a few inputs and plot each slope as a point on the graph of . To estimate a slope, draw the tangent line at the input and divide its rise by its run between two points on it taken from the grid.
- Join the points with a smooth curve. Leave a break at each corner.
Example 6
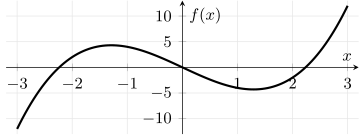
The graph of the function
has a peak near and a valley near . Sketch .
ShowHide solution
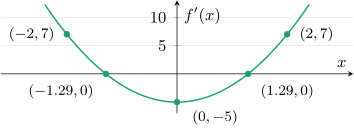
The derivative is zero at and , because the tangent line is horizontal at the peak and at the valley. The sign of is positive to the left of the peak and to the right of the valley, because rises there. Between the peak and the valley the sign is negative, because falls there.
Estimate three slopes, two from the graph and one by symmetry. Draw the tangent line at on the grid. It passes through and about , and its slope is about
Draw the tangent line at . It passes through and about , and its slope is about
The slope at is also about 7, because the graph is symmetric about the origin: the part of the graph near is the part near rotated half a turn about the origin. The slope falls from about 7 at to about at and climbs back to about 7 at , and by the same symmetry the slopes at and match. Therefore, the sketch of is a U-shaped curve, symmetric about the vertical axis, with its lowest point near , and the curve crosses the -axis at the peak and the valley inputs.
Example 7
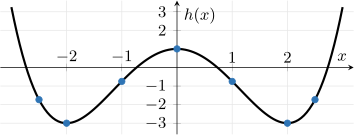
For the graph of , determine where is zero, positive, and negative among the inputs
ShowHide solution
- The derivative is zero at , , and , because the graph has a valley, a peak, and a valley there.
- The derivative is positive at and , because rises there.
- The derivative is negative at and , because falls there.
Example 8
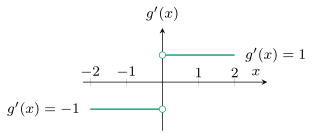
Sketch the derivative of
ShowHide solution
For , equals , because the graph of there is a line of slope . For , equals , because the graph there is a line of slope .
At the corner , the slope is on the left and on the right. Because these two slopes differ, the graph has no single tangent line at , and is undefined.
The sketch is a horizontal line at for and a horizontal line at for , with a break at . The open dots at and mark that is undefined.
Found a mistake, a broken tool or something unclear? Report a problem